
Big Data Bundle
Stop hitting a wall when your data outgrows a single spreadsheet.
Combine Power BI, Power Query & Power Pivot, and Python in Excel: build interactive dashboards, automate your Excel reporting, and handle larger, messier data than formulas or a single tool can comfortably manage. Built for finance professionals, taught by one.
- Build interactive Power BI dashboards, automated Excel reports, and Python-powered analysis, using one consistent finance dataset throughout
- Automate the data preparation behind every report, not just the finished output
- Work confidently with larger, messier data than formulas alone can handle
- 17 hours of practical, finance-specific training, three CPD certificates
12-month access · No subscription · 3 CPD certificates included
Enrol Now: £565 + VAT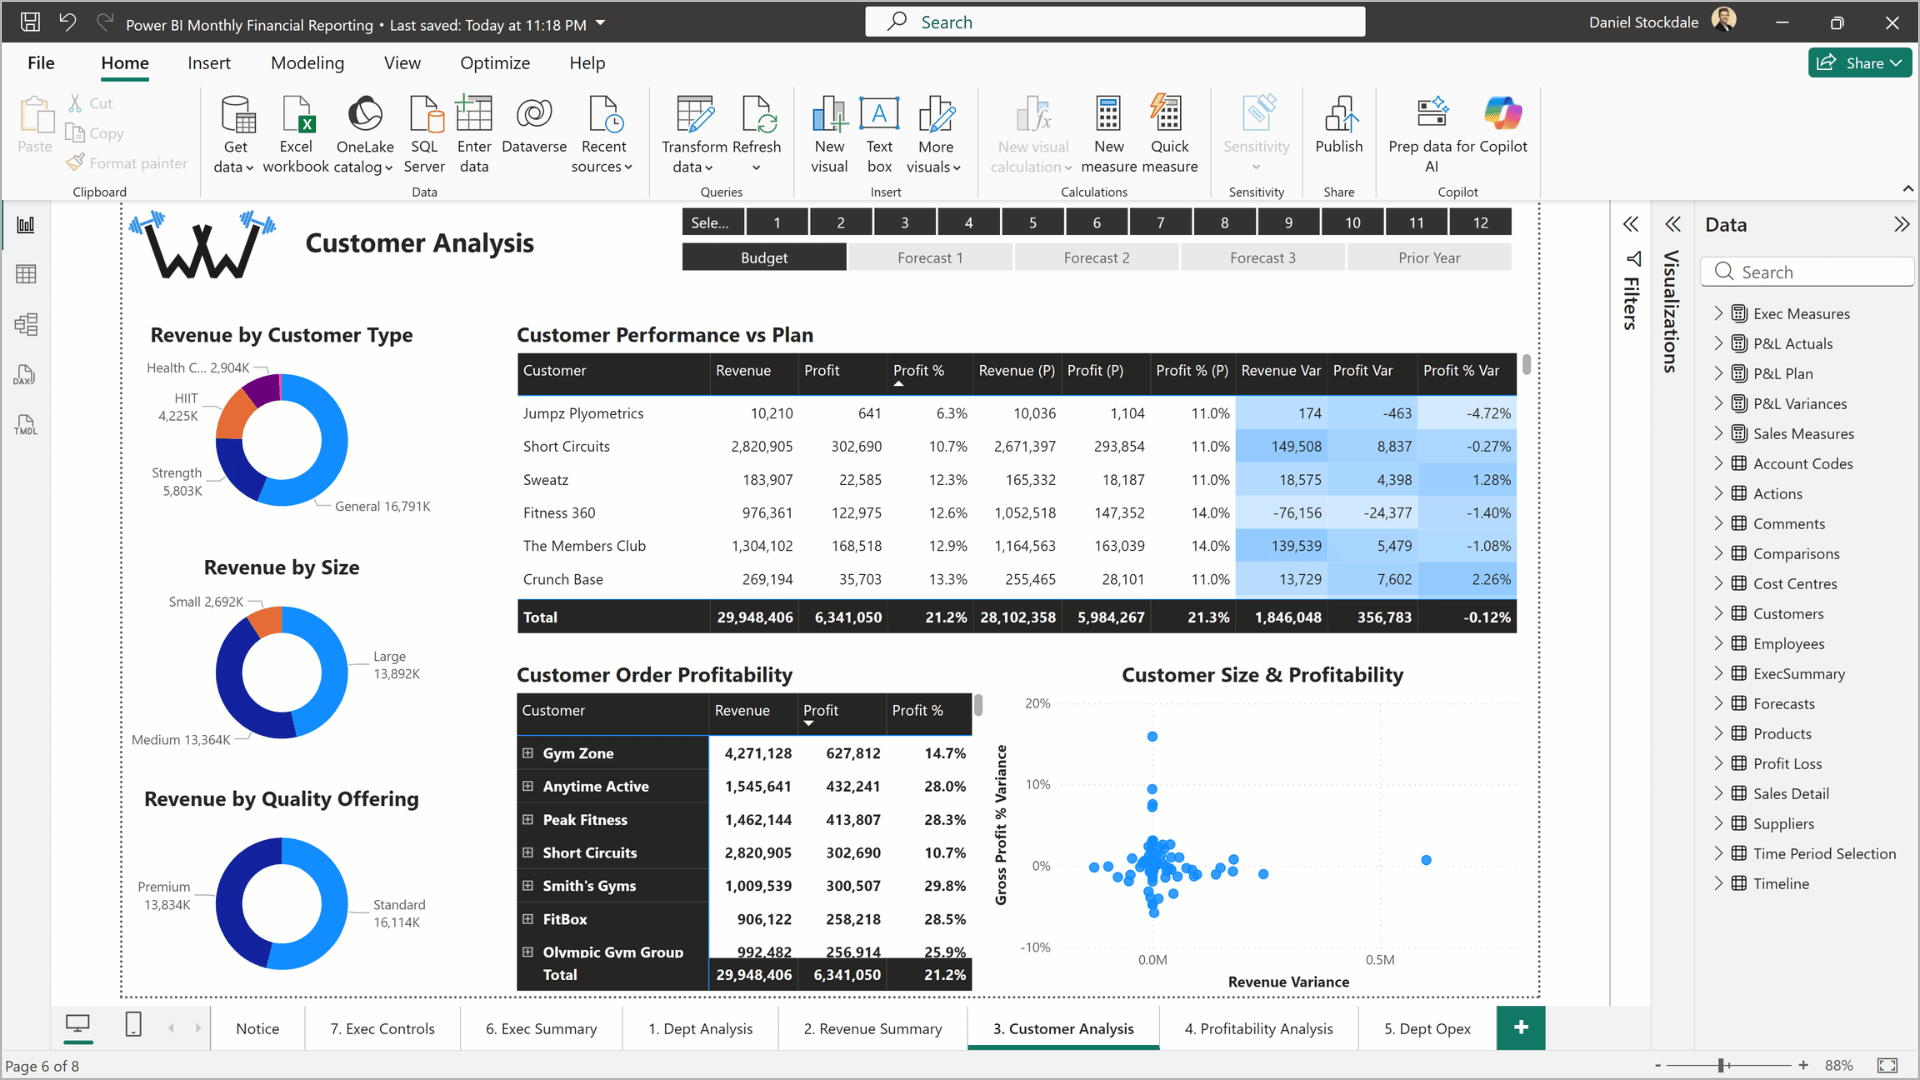
Customer analysis: compare and analyse performance versus a selected forecast (Power BI)
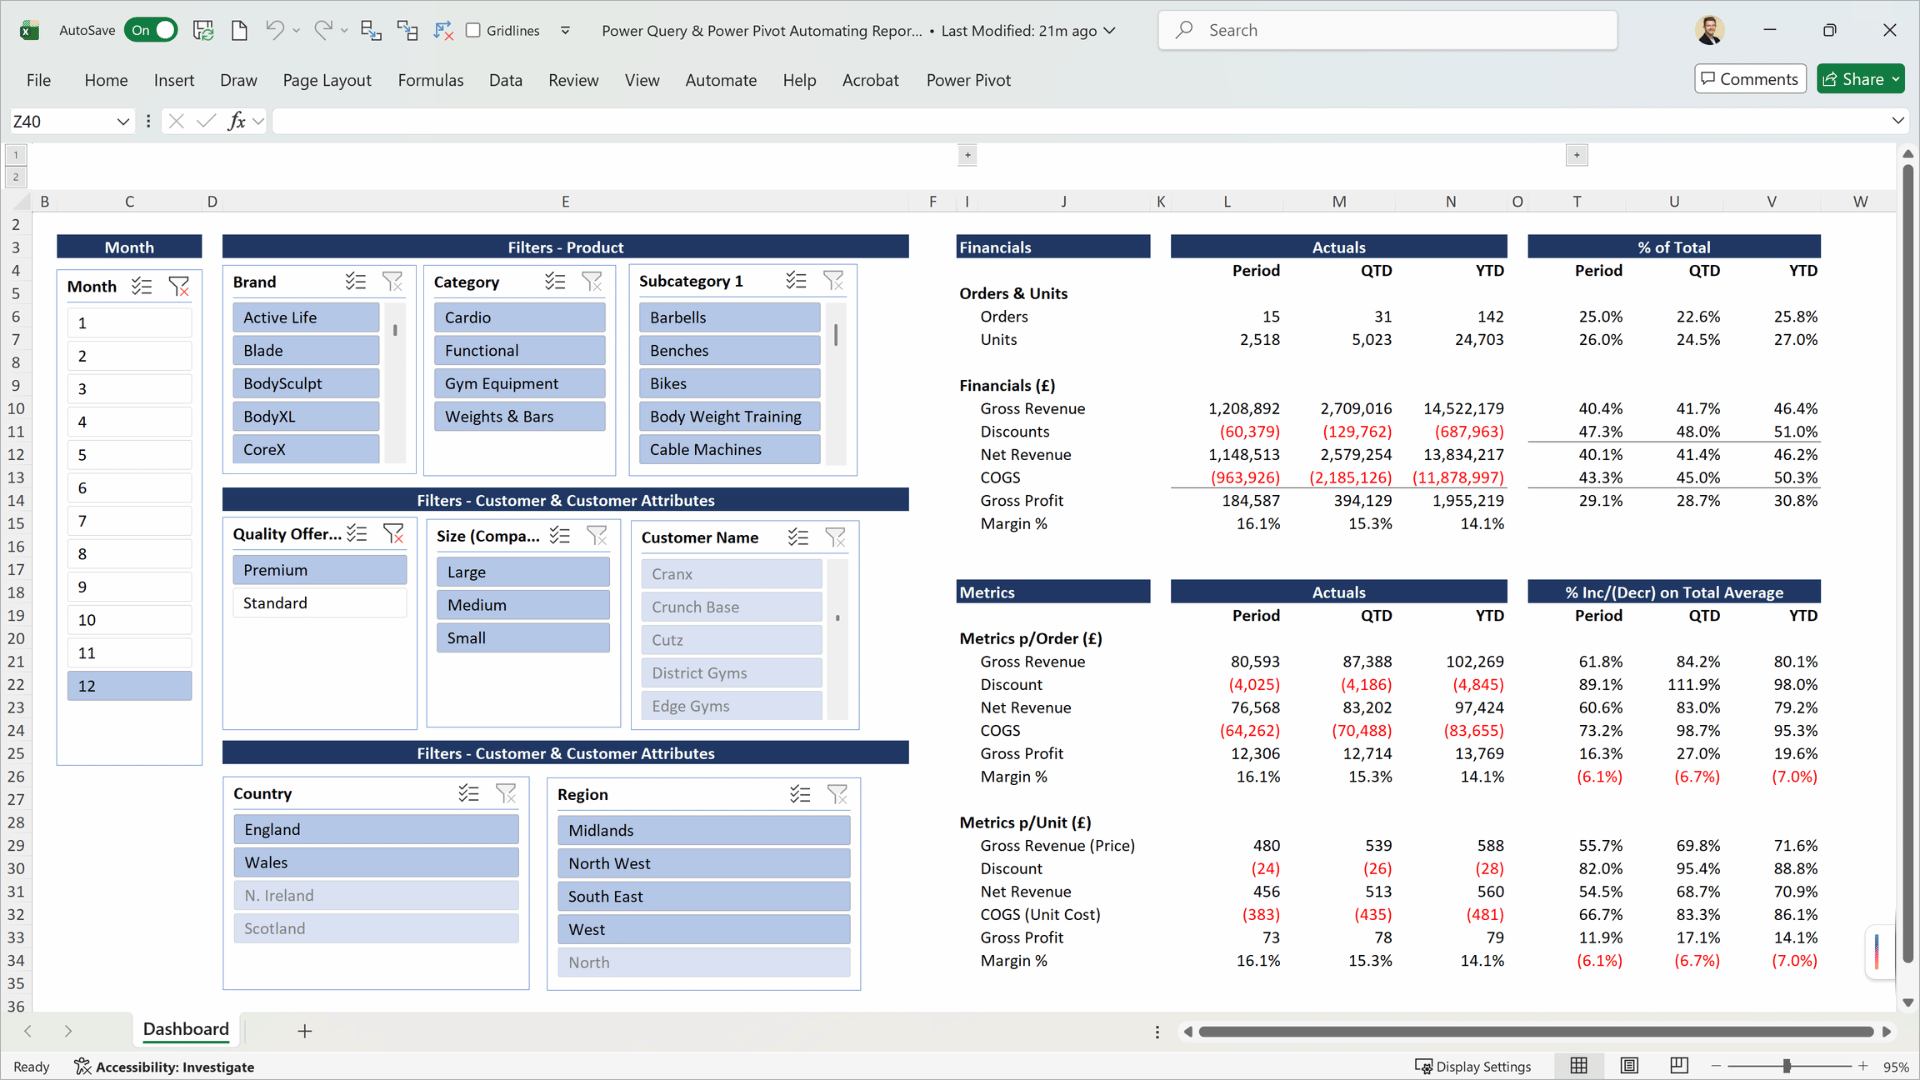
Sales dashboard: apply slicers in Excel to filter large datasets in the data model, instantly returning key financial metrics (Power Query & Power Pivot)
















The PROBLEM
Every month, the same manual rebuild – and a ceiling on what the data can handle.
You build the report. You send it out. Someone asks for a different cut, and you're back in the spreadsheet. Meanwhile, larger or messier data slows formulas down or breaks them outright.
✗ Time
Month-end is still largely manual and repetitive, for a process regular enough that it shouldn't be.
✗ Value
Static, number-heavy reports don't hold a stakeholder's attention, and every follow-up becomes another data request.
✗ Data Limitations
Large or messy datasets slow down or break traditional spreadsheet methods.
The solution
Build it once. Let the data, and the tool, do the rest.
Three complementary courses, one finance dataset throughout: automate the reporting you already do, and pick up a working toolkit for the data that doesn't fit neatly into a formula.
✓ Automated
Data extracted, cleaned and calculated automatically. Reports refresh at the click of a button.
✓ Self-serve
Stakeholders filter, drill down, and explore dashboards themselves, instead of coming back to Finance.
✓ Scalable
Python in Excel picks up where formulas and Power Query start to strain: messier, larger, more conditional data.
Compare the three courses
Three courses, three different jobs.
Same finance-specific dataset throughout (the fictional Workout Warehouse). Three different outputs.
Power BI
Monthly Financial Reporting
Builds
Six interactive dashboards
Best suited to
Stakeholders who explore and self-serve on reporting
Core Content
8.5 hrs video · 6 quizzes · 5 challenges
£345 + VAT
Power Query & Power Pivot
Automating Reporting
Builds
A P&L and a Sales Dashboard in Excel
Best suited to
Number-focused reports that need to summarise large datasets
Core Content
4 hrs video · 4 quizzes
£245 + VAT
Python in Excel
Working with large data
Builds
DataFrame cleaning, analysis, charts
Best suited to
Messy/large data, reviewing code produced by Copilot
Core Content
4.5 hrs video · 4 quizzes
£215 + VAT
Why together
Why these three courses work together
Power BI and Power Query & Power Pivot are built on the same technology. Python in Excel isn't an extension of that – it's a different toolkit for a different part of the job.
Power BIPower Query & Power Pivot
Same technology, different output
Both share Power Query, a data model, and DAX. Learn one and the other is faster to pick up – you're reusing the modelling and DAX skills, not starting again. What changes is the output: interactive dashboards vs number-focused Excel reports. Many finance teams end up wanting both.
Python in Excel
A genuinely different toolkit, not more of the same
Python in Excel doesn't use Power Query, a data model or DAX – so the "faster to learn once you know the other" argument doesn't carry across. It isn't a bigger version of what Power Query & Power Pivot already does (that course already handles millions of rows on its own). It earns its place for two specific reasons: custom, conditional or repeated data cleaning that's awkward to build as a sequence of Power Query steps; and reading and sense-checking the Python code Microsoft Copilot increasingly generates inside Excel, rather than trusting a formula you can't verify.
Power BIPower Query & Power PivotPython in Excel
Together: more of the pipeline, covered by your own team
Python in Excel for the larger or messier data that formulas and Power Query handle less comfortably; Power Query, Power Pivot and DAX for the structured modelling and automation underneath every report; Power BI or Power Query & Power Pivot for the finished output, whichever your stakeholders need. Not three courses on the same subject – three parts of the same pipeline.
Who this bundle is for
Is this bundle right for you?
Designed for accounting and finance professionals with regular financial or commercial reporting duties.

Finance role
You work in FP&A, management accounting, financial reporting, or a similar finance role

Regular reporting
You produce monthly or regular reports, and want to go further than one tool alone can take you

Excel user
Comfortable with Excel formulas – no prior Power BI, Power Query or Python experience needed

Ready to automate
You want a wider working toolkit: visual, Excel-native, and code-based
Power Query & Power Pivot: Comfortable with Excel formulas is enough – if you can write a VLOOKUP/XLOOKUP or SUMIFS, you're ready. No prior experience is needed. Both require Windows; neither is available for Mac.
Python in Excel: No coding experience of any kind required. Runs on Windows and, increasingly, on Mac for Business and Enterprise Microsoft 365 plans – the one course of the three with a growing Mac rollout.
Which course(s) do you need
Not sure if you need all three?
An honest breakdown – including when the full bundle isn't the right answer yet.
Want stakeholders to explore dashboards themselves? Power BI on its own. View course →
Need number-focused reports that live in Excel? Power Query & Power Pivot on its own. View course →
Want both of the above? The Power Automation Bundle – save £125. View bundle →
Also handle larger or messier data, or want to read Copilot-generated Python code? Add Python in Excel – only £150 more than the Power Automation Bundle. This is the Big Data Bundle, below.
See what you'll build
Three different courses, three different jobs
Examples of what you'll create in the courses, to take forward and apply to your own work
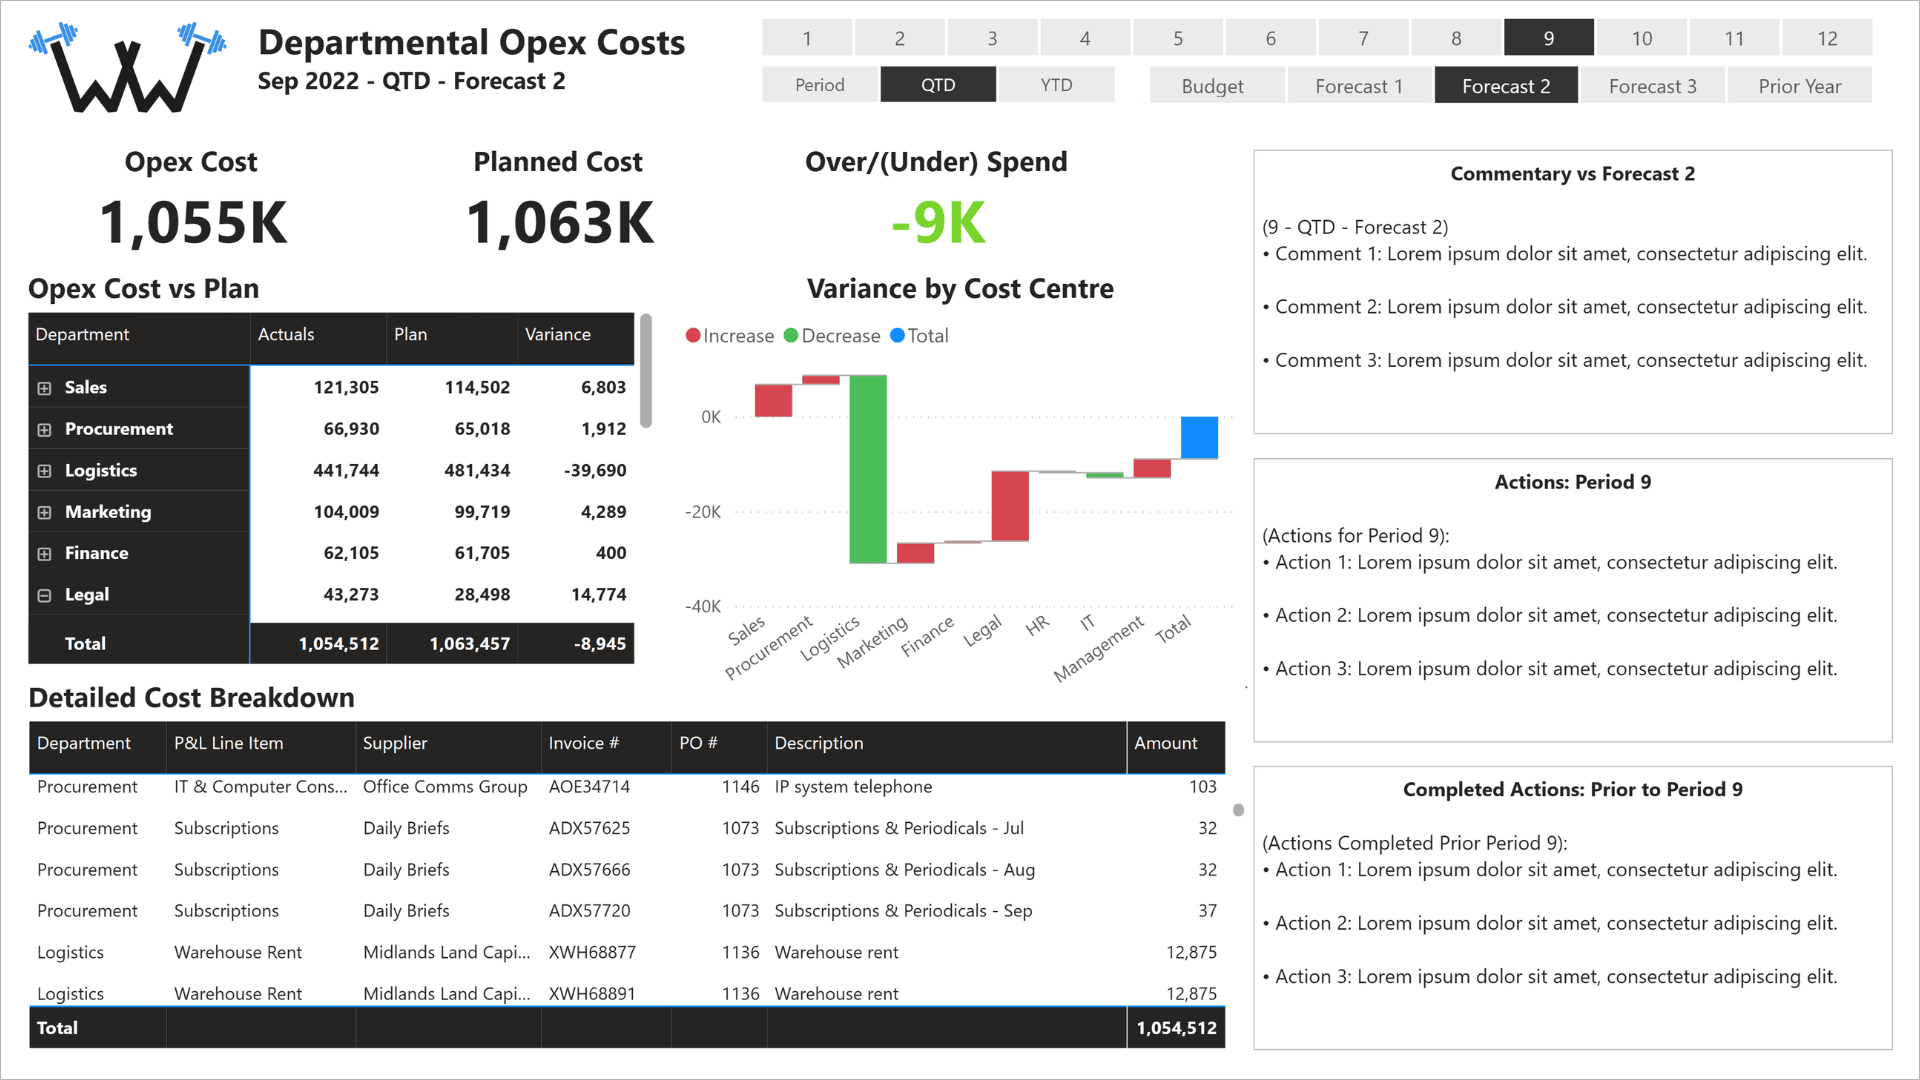
Departmental opex costs: align commentaries with data by Period, QTD, YTD (Power BI)
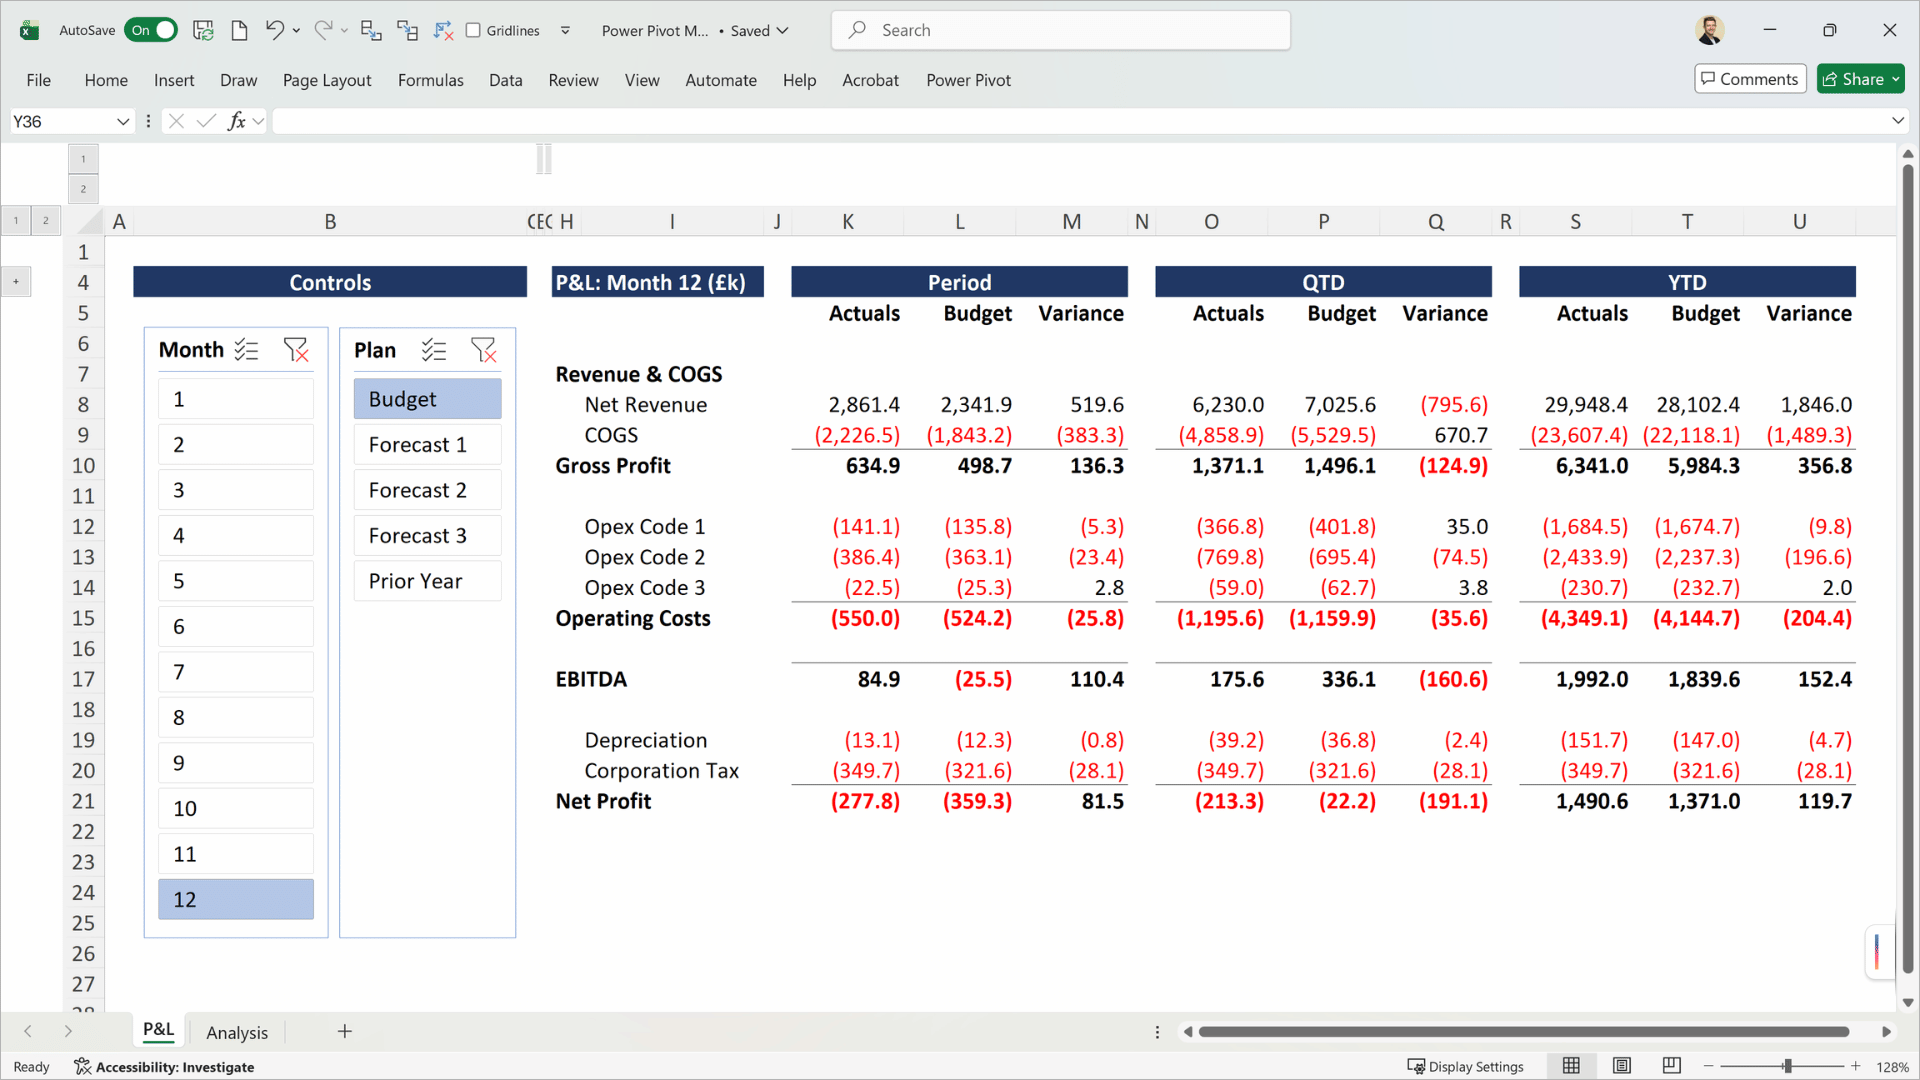
P&L (abridged): present actuals by Period, QTD, YTD versus the selected forecast by filtering the underlying data model (Power Query & Power Pivot)
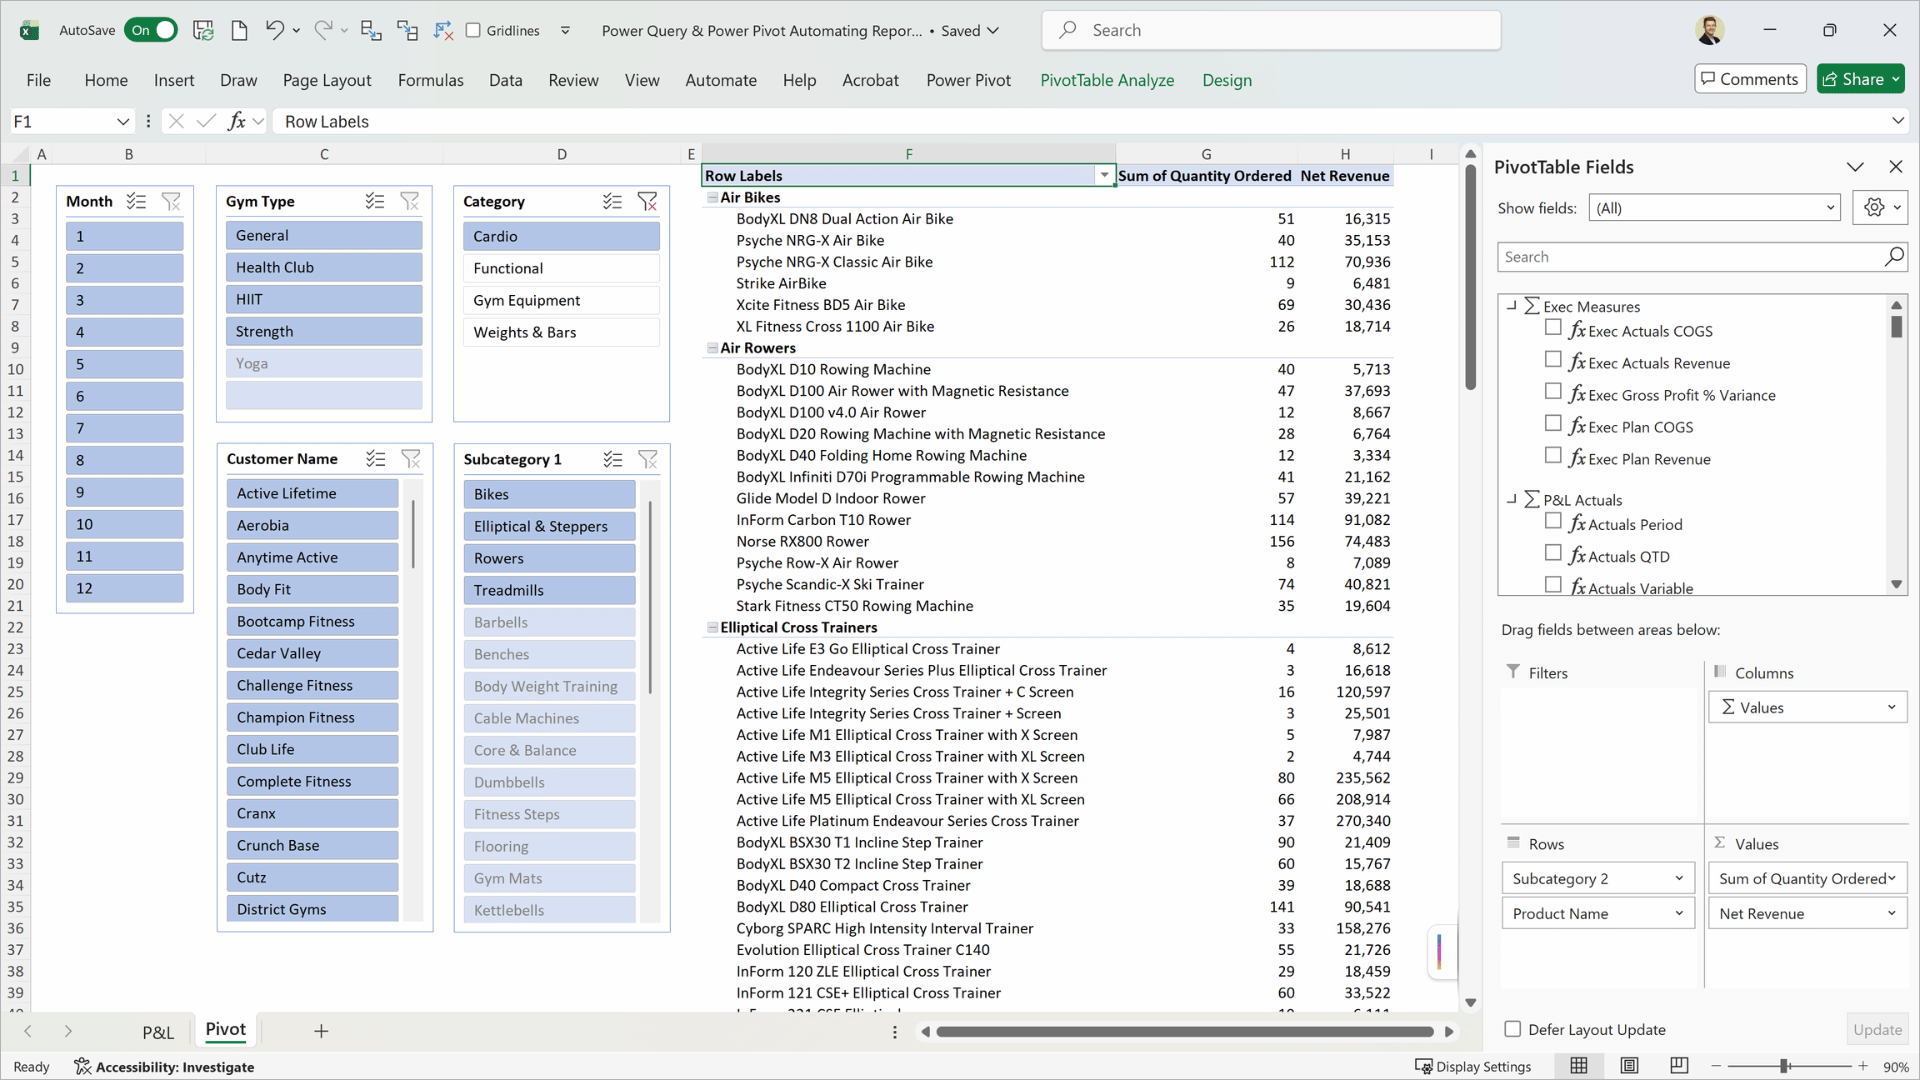
PivotTables: connect to and explore big datasets sitting in the data model (Power Query & Power Pivot)
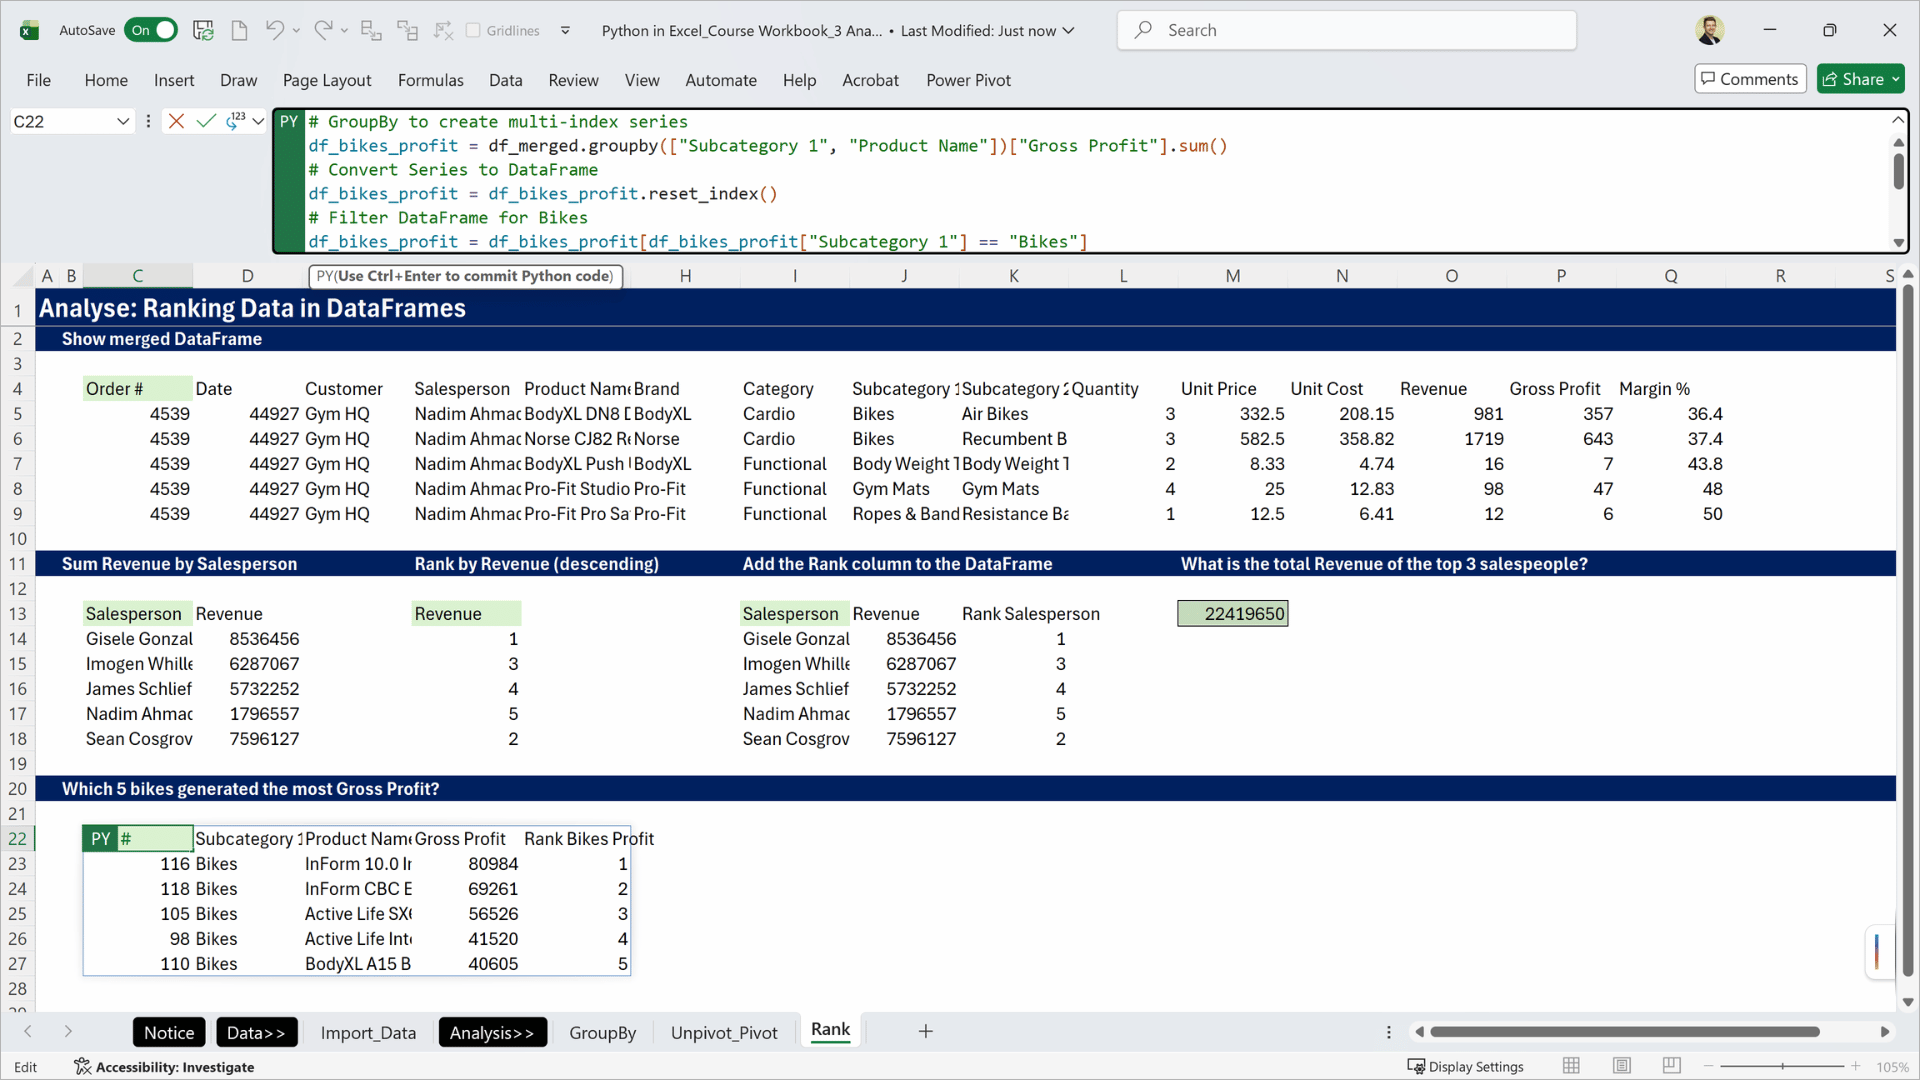
Work with large data: import, clean, calculate and summarise large datasets directly in Excel using Python code (Python in Excel)
What is included
Everything included in the bundle
Three courses, one combined package of materials.

17 hours of video
Theory, demos and hands-on exercises across all three courses

9 reports + Python outputs
6 visual dashboards, 3 Excel reports, plus DataFrame & Matplotlib work

Two slide decks
155 pages combined, downloadable full course theory
Realistic datasets
Actuals, budget, forecast 1–3, prior year, customer and product data

Three CPD certificates
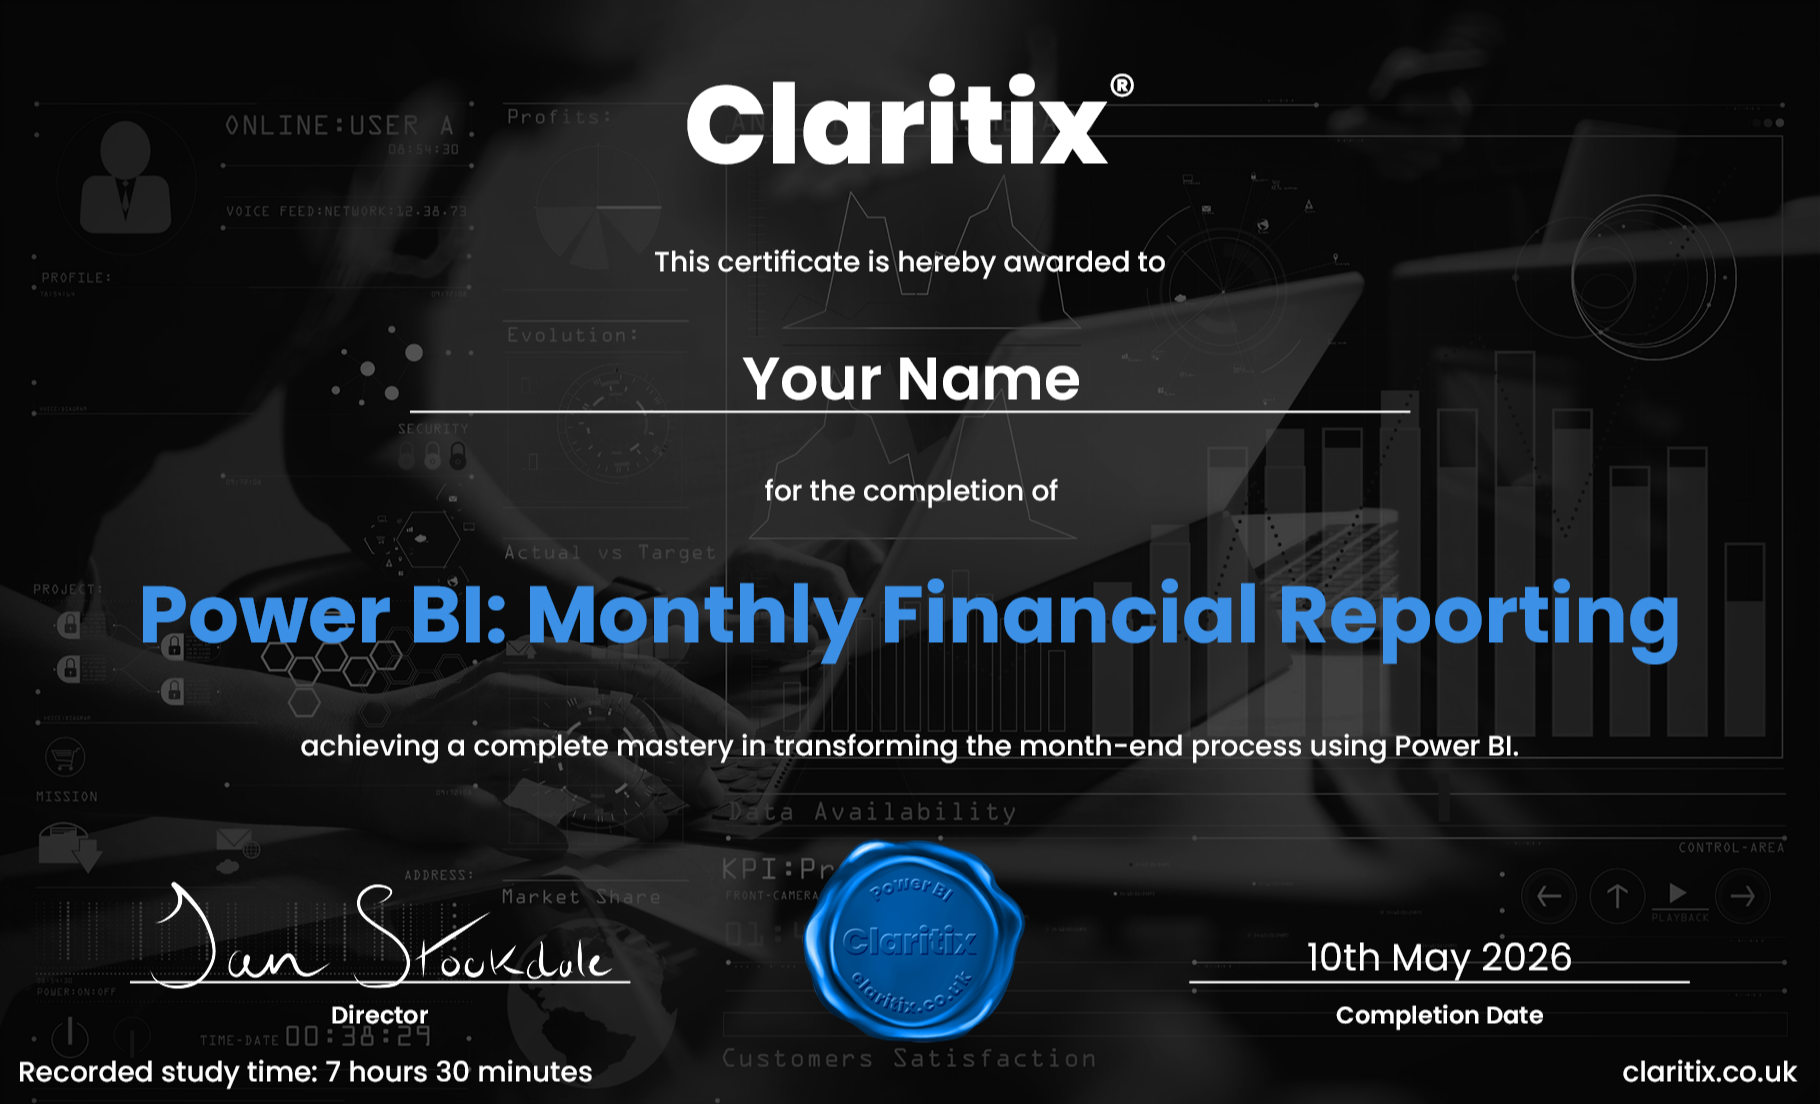
Personalised PDF certificates for CPD records on completion

12-month access
Learn at your own pace – no pressure, no subscription, no auto-renewal
About the course creators
Built by finance professionals, for finance professionals

Dan Stockdale
CIMA-qualified · 19+ years in finance · Former PwC consultant
Dan built all three courses after years of watching finance teams present the same static reports every month, then rebuild them by hand the next. He wanted courses that taught each tool in the context of real finance work, not generic data examples, and that left learners able to build outputs finance teams actually use: dashboards stakeholders can explore themselves, automated Excel reports, and Python-based analysis for the data the other two tools handle less comfortably.

Oliver Deacon
Former Finance Director, Microsoft Seattle · Finance Leadership Coach
The Power BI and Power Query & Power Pivot courses have been built in collaboration with Oliver Deacon, who spent several years as a Finance Director at Microsoft in Seattle, where he worked at the cutting edge of leveraging technology and data in financial and commercial reporting.
He experienced firsthand the value generated by using these technologies to redesign processes, raise the quality of output while reducing the time spent doing so, and extract more value and insight from the organisation’s data.
"As a former Microsoft Finance Director, I know how crucial effective month-end reporting to drive action is. We spend so long building manual reports, only for the business to ask us for a different cut or more data – if they even look at them at all!
We built these courses to provide finance teams with everything they need to create insightful and actionable commercial month-end reports."
Oliver Deacon
Former Finance Director, Microsoft · Power BI and Power Query & Power Pivot course contributor
Testimonials
What learners say

"The course provided me with the essential foundations in data structure, mapping, and reporting, enabling me to create impactful dashboards from scratch. It not only saved me time and streamlined processes but also empowered me to deliver innovative solutions that added significant value to our business."
Pieria Protopapa
FP&A Manager, Clear Business
"Superb way to learn Power BI! Clearly geared to accountants and the financial reporting process."
Khilan Haria
Head of Strategic Planning, David Lloyd Leisure
"Dan offers an easy introduction into Power BI whilst in the environment accountants feel most comfortable.
Good pace and expansion into technical areas allows for one to come away ready to apply in your own setting."
Kevin Greenaway
Finance Director, The YES YES Company
Certificate & CPD
Three certificates. Evidence for your CPD record.
On completion of each course you'll receive a personalised PDF certificate showing your name, the course title, completion date and study time. All three are designed to support CIMA, ACCA, ICAEW, or CIPFA CPD record-keeping. A VAT receipt is available for expensing through your employer's training budget.
Outside the UK, particularly in the US, please check your professional body's requirements – Claritix courses are not currently NASBA-certified.
Free resource
Not ready to enrol yet? Start here for free.
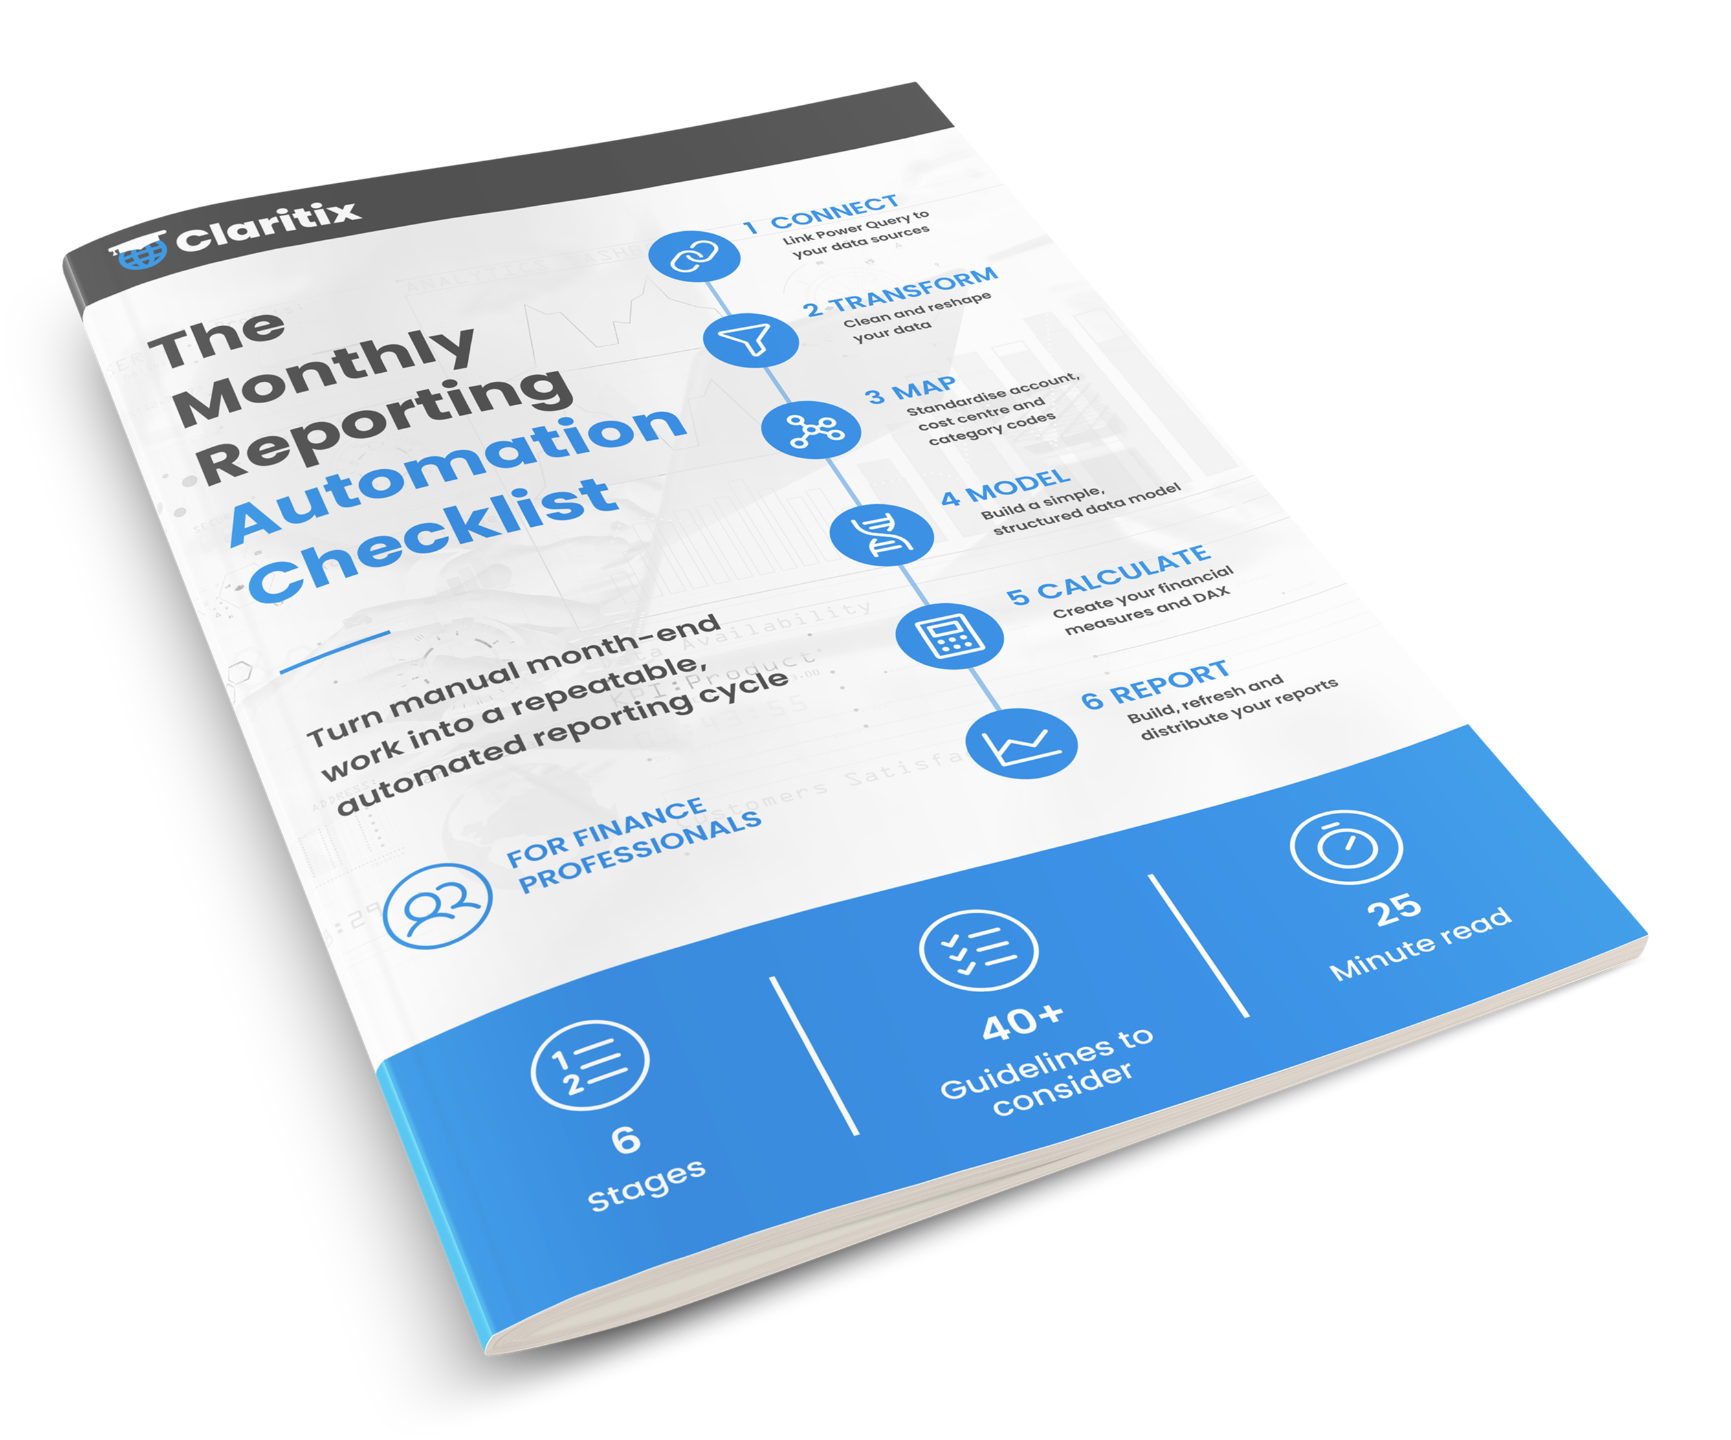
Download the Monthly Reporting Automation Checklist, a free guide covering all six stages of automating your monthly reporting. It maps directly to the Power BI and Power Query & Power Pivot courses in this bundle.
Sign up below and we will send it straight to your inbox. No spam. Unsubscribe at any time.
By subscribing you agree to your data being stored and receiving occasional marketing emails.
Pricing
Invest in yourself
12-month access to all courses. Single payment, no subscription, no auto-renewal.
Big Data Bundle ★ Save £240
£565 + VAT
Save £240 vs £805 separately · 12-month access
Enrol in the Big Data BundleAlready own one of these courses? Ask about upgrade pricing and we'll get you the other two at the fair bundle-equivalent price, rather than the full individual price.
FAQ
Frequently asked questions
Do I need all three courses, or would one or two cover what I need?
Which course should I start with?
Is my ability level good enough for all three courses?
Power BI and Power Query & Power Pivot use the same technology – is Python in Excel really the same kind of thing?
I've never written code before – will I actually be able to pick up Python in Excel?
Will Python in Excel work on my version of Excel?
Can Power BI and Power Query & Power Pivot run on a Mac?
I already own the Power Automation Bundle, or one of these courses – can I add the rest at a fair price?
How many certificates will I get, and can I use them for CPD?
What happens after I buy?
Ready to start?
Ready to build a wider data toolkit?
Enrol today and get immediate access to all three courses, every exercise file, and both slide decks. Learn at your own pace over 12 months.
12-month access · No subscription · CPD certificates included · Immediate access on purchase