
POWER BI: MONTHLY FINANCIAL REPORTING
Stop being asked for "one more cut" of the data.
Learn Power BI in the context of monthly financial reporting: automate the numbers behind your reports and present them as interactive dashboards your stakeholders can explore for themselves. Built for finance professionals, taught by one.
- Build a complete suite of six financial reports
- Automate the data preparation behind every report, not just the visuals
- Let stakeholders filter, drill down, and self-serve, instead of coming back to Finance
- Designed specifically for finance professionals, not a generic data audience
12-month access · No subscription · CPD certificate included
Enrol Now: £345 + VAT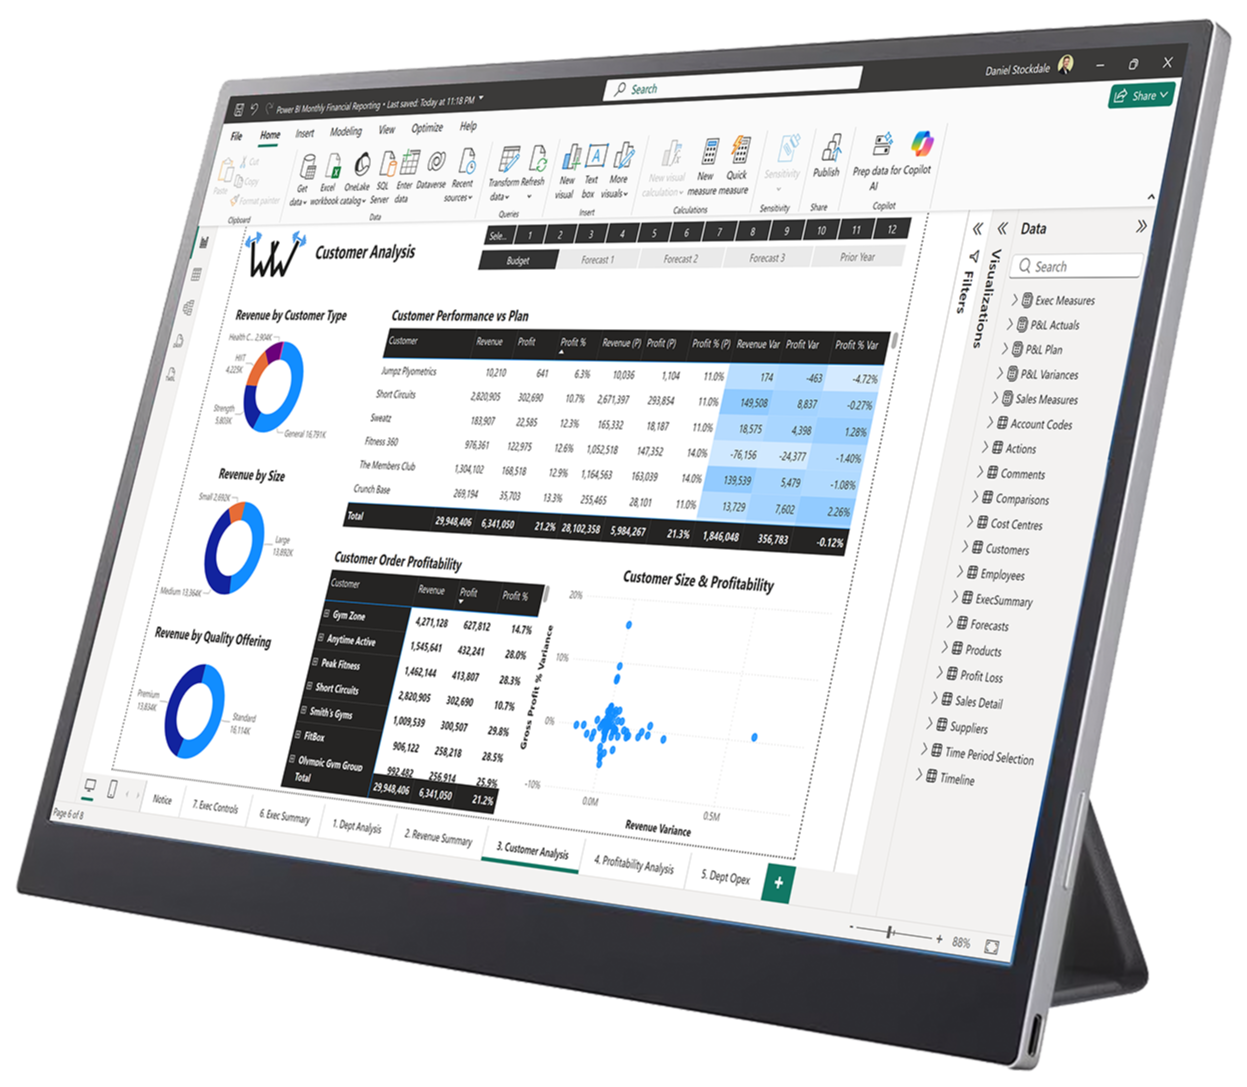



















The PROBLEM
Every month, the same static report and manual workload.
You build the report. You send it out. A week later, someone asks for a different cut, a different filter, a different month, and you are back in the spreadsheet doing it again.
✗ Time
Month-end reporting is a critical finance process, but it is still largely manual and repetitive. A process this regular should not still take this long.
✗ Risk
Manual processes introduce errors that carry forward into future reports. Data integrity depends entirely on whoever built the spreadsheet.
✗ Value
Static, number-heavy reports do not hold a stakeholder's attention. Every follow-up question becomes another data request for Finance to handle manually.
The solution
What if the report could update and then answer questions itself?
Power BI automates the preparation and visualisation of your data. You build it once. After that, it refreshes at the click of a button. Stakeholders filter, drill into, and explore the data themselves, reducing the need for follow-up questions.
✓ Automated
Data extracted, cleaned, and calculated automatically. Reports refresh at the click of a button, every month.
✓ Robust
Every transformation and calculation is recorded and consistent. What a stakeholder sees is what the data model actually contains.
✓ Flexible
Business partners explore the detail themselves: filter by department, drill into a customer, switch between actuals, budget, and prior year. Fewer meetings spent walking people through numbers.
Why Power BI
Why Power BI, and not just Excel?
Power Query and Power Pivot, taught in Claritix's other automation course, produce number-focused reports in Excel: P&Ls and dashboards using CUBE functions. Power BI produces visual, interactive reports that stakeholders access through a browser and explore themselves.
Both use the same underlying technology: Power Query, a data model, and DAX. The difference is the output, and who it is built for. Many finance teams end up using both.
- Built on the same Microsoft data model and DAX language used in Power Query and Power Pivot, so the two courses reinforce each other
- Interactive, browser-based reports rather than static files: stakeholders self-serve on filters, periods, and comparisons
- Information and insights conveyed through colours, shapes and size, rather than numbers alone
- Reports can be shared securely with role-based access, so different teams see only what is relevant to them
- Widely adopted across large organisations, making it a transferable, in-demand skill beyond your current role
Who this is for
This course is for you if…
Designed for accounting and finance professionals with regular reporting responsibilities.

Finance role
You work in FP&A, management accounting, financial reporting, or a similar finance function

Regular reporting
You produce monthly or regular reports for stakeholders who ask follow-up questions

Limited experience
You have not used Power BI before or have some experience but know there is more to learn

Ready to automate
You want to simply hit Refresh to generate reports that stakeholders can then explore themselves
What you need to know already: No prior Power BI experience required. Some familiarity with Excel is helpful – if you can create a PivotTable, you have what you need. Note: Power BI Desktop is Windows-only and does not have a native Mac version.
Course overview
See the course in six minutes
A short walkthrough of what the course covers and what you'll build.
▶ 6 minutes · No sign-up required
What you will be able to do
By the end of this course, you will be able to:
The course has three goals: to teach you Power BI from scratch, to transform your workflows through automation, and to develop your ability to create finance-relevant reports.
✓ Use Power Query to connect to multiple data sources and automate the monthly data refresh
✓ Build a data model in Power BI that maps relationships robustly and reliably
✓ Write DAX measures: Revenue, COGS, Gross Profit, Margin %, for Period, QTD, and YTD
✓ Build six finance reports, including a profitability analysis, a revenue summary, and a departmental opex variance report
✓ Toggle actuals against budget, forecast, and prior year, with variances calculated automatically
✓ Build dynamic commentaries that update automatically with the filters selected – aligning with the numbers presented
✓ Apply row-level security so stakeholders see only what is relevant to them
✓ Publish and share reports through Power BI Service
Course outcomes
Examples of the reports you'll build
Three of the six reports from the course, built entirely in Power BI using the Workout Warehouse dataset.
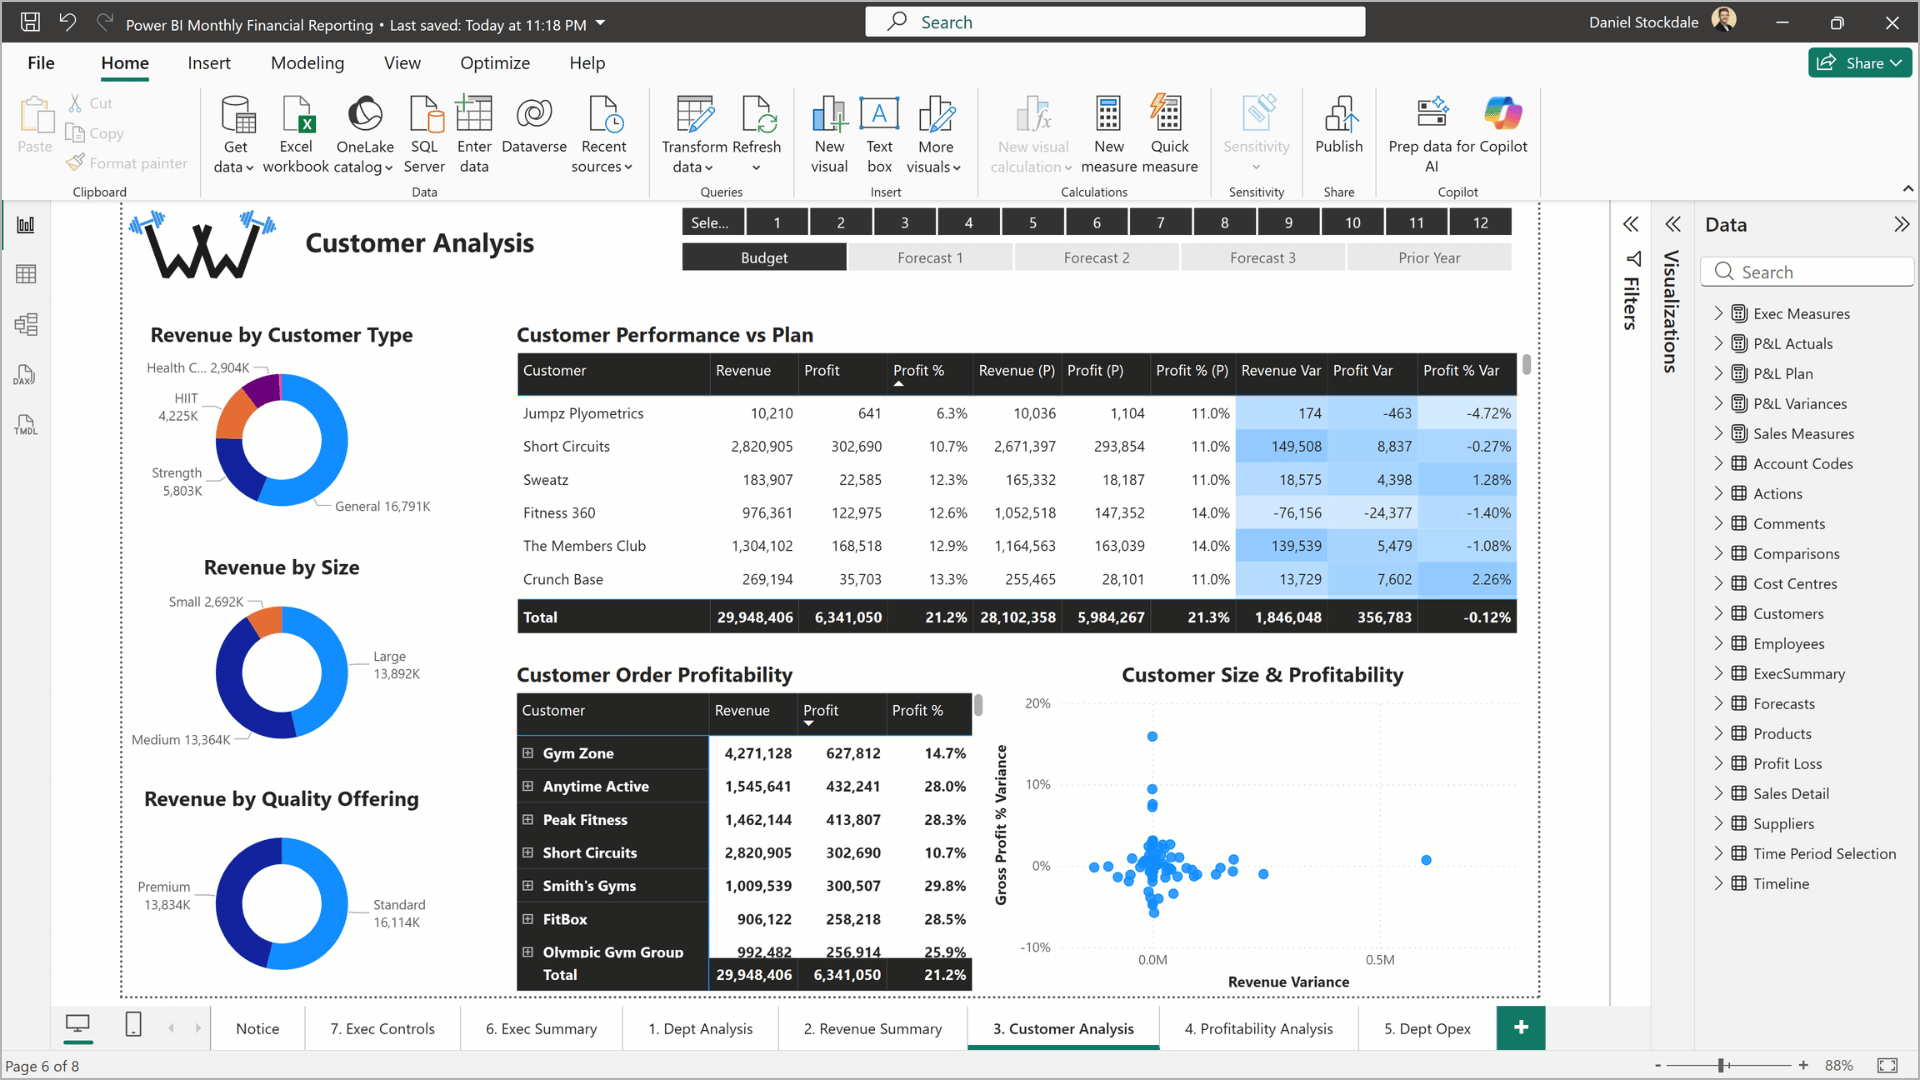
Customer analysis: compare performance versus a selected forecast (report shown in Power BI Desktop)
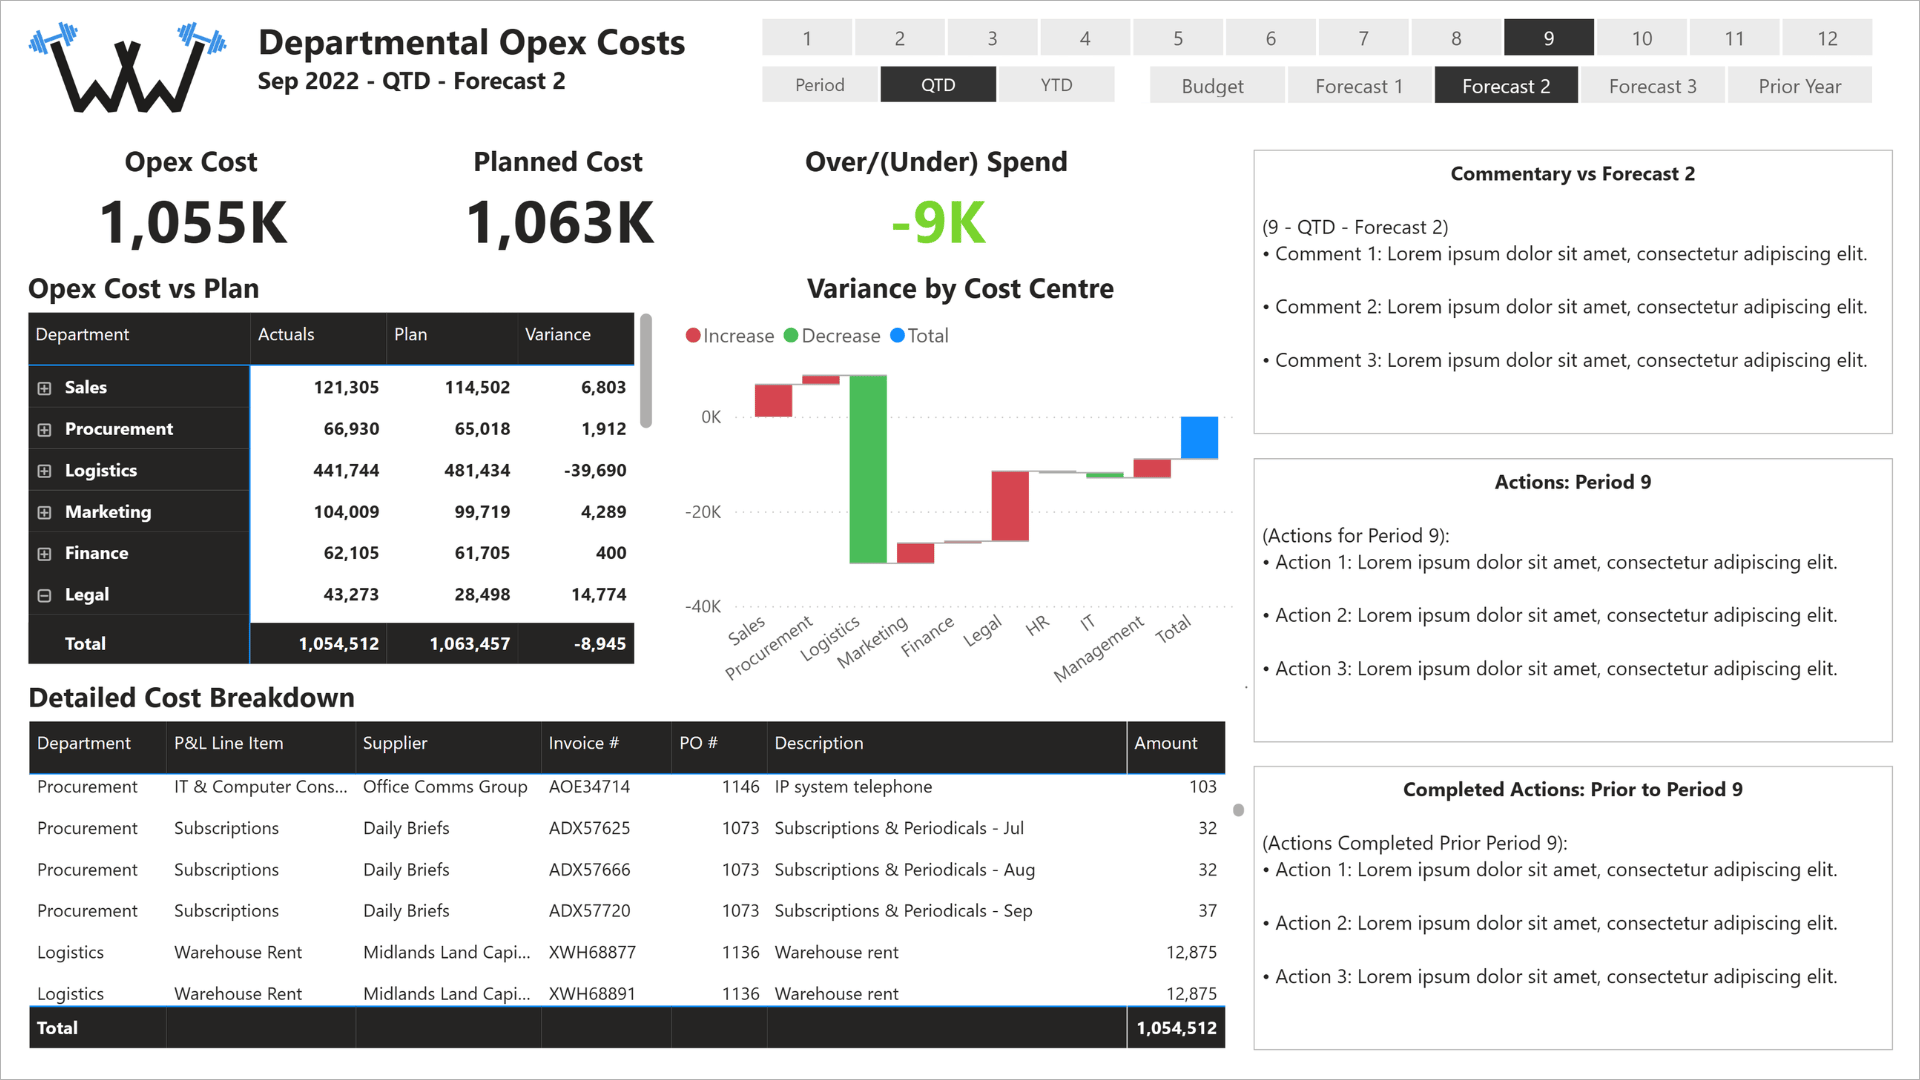
Departmental opex costs: align commentaries with financials by the selected forecast and Period, QTD or YTD
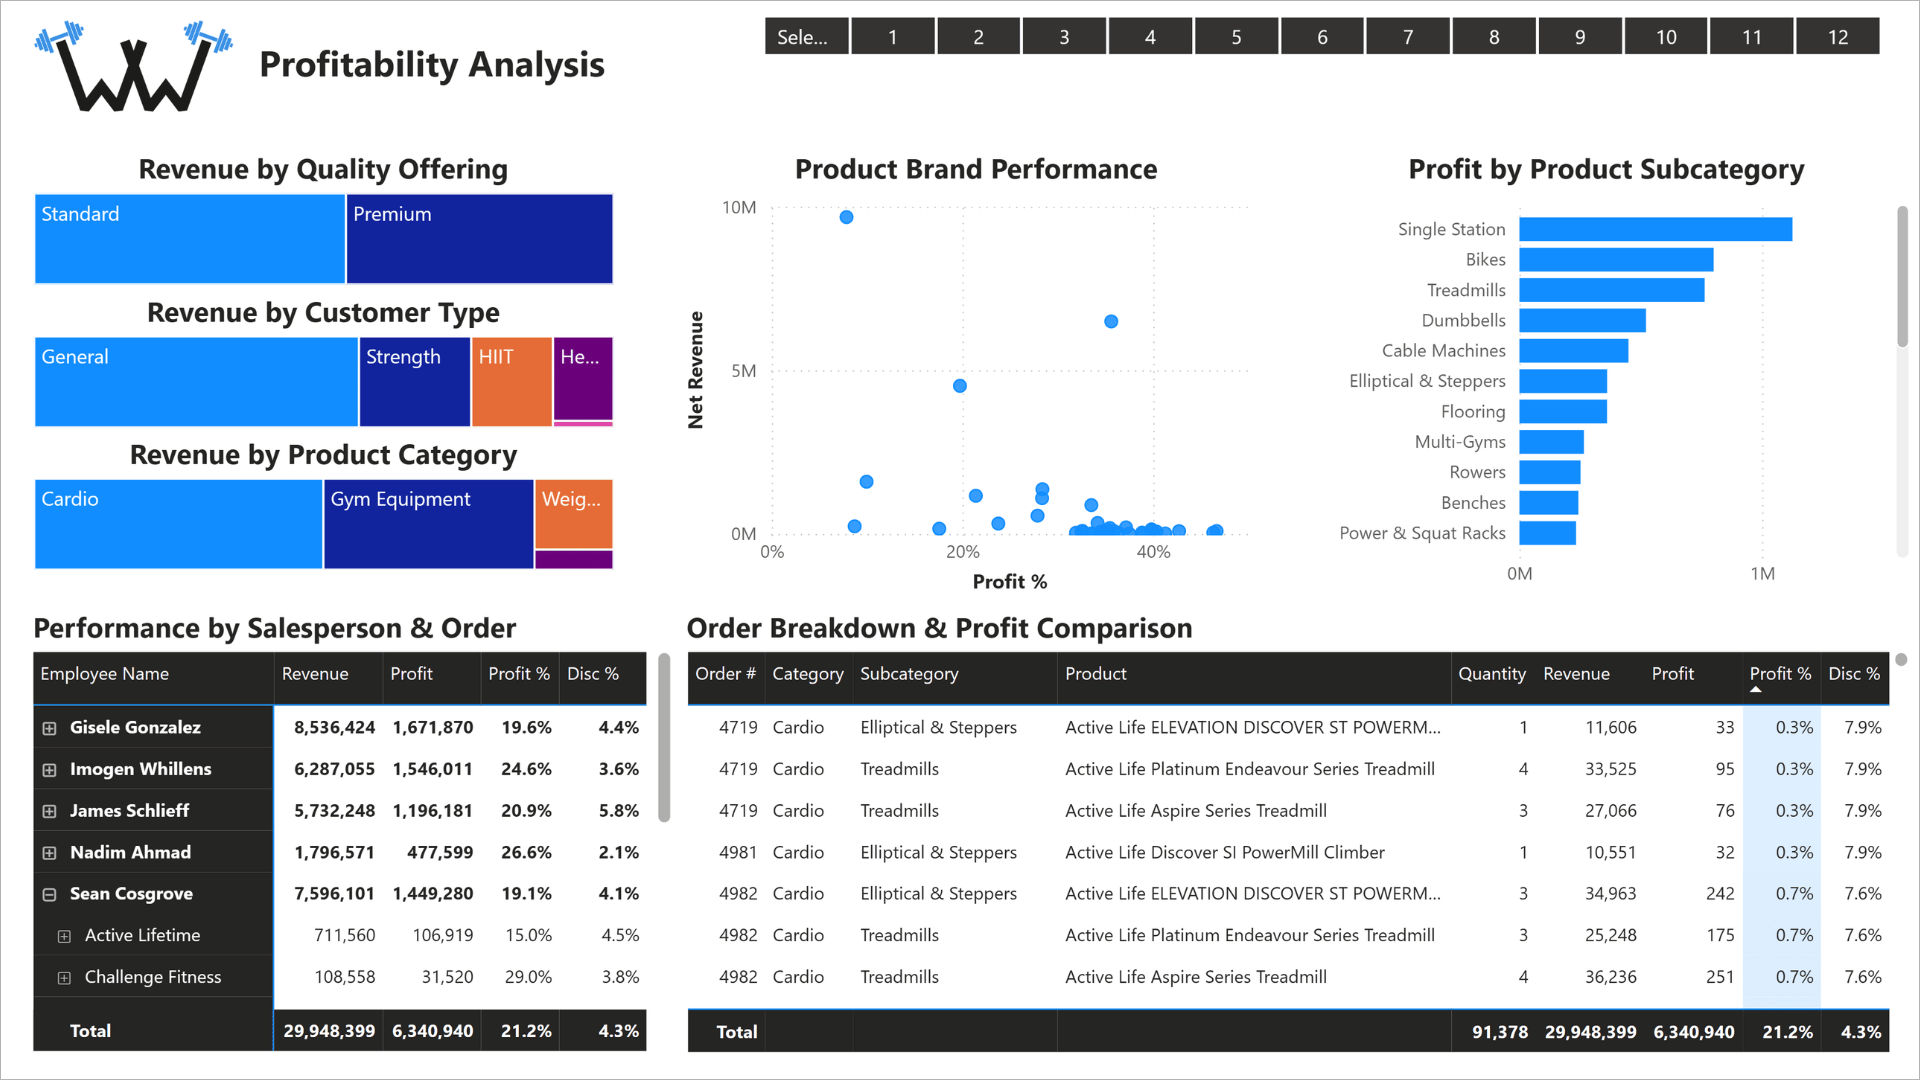
Profitability analysis: generate commercial insight from big data
Course content
What the course covers
6 sections · 8.5 hours of video · 92-page slide deck · 6 quizzes · 5 challenges
Each section begins by framing the reporting problem, then shows exactly how Power BI solves it.
Context is finance-specific throughout.
1. Course Fundamentals
2. Import & Transform Data
3. Creating the Data Model
4. DAX
5. Creating Reports & Visualisations
6. Sharing Reports (Power BI Service)
What is included
Everything you need to learn, practise, and apply
The course is not just video. You get a complete package of materials to support your learning and apply it immediately.

92-page slide deck
The full course theory in one downloadable reference document

Power BI files
Files capturing each stage of the course build – follow along or catch up at any point

Realistic datasets
Actuals, budget, forecast 1-3, and prior year financial data, plus a large dataset to demonstrate performance at scale

6 quizzes, 5 challenges
Test your understanding and apply it practically at each stage

Completion certificate
Personalised PDF certificate for CPD records on completion

12-month access
Learn at your own pace – no pressure, no subscription, no auto-renewal
About the course creators
Built by finance professionals, for finance professionals

Dan Stockdale
CIMA-qualified · 15 years in FP&A and financial modelling · Former PwC consultant
Dan built this course after years of watching finance teams present the same static reports every month, then field the same follow-up questions by hand. He wanted a course that taught Power BI in the context of real finance work, not generic data examples, and that left learners able to build reports finance teams actually present: variance analysis, departmental breakdowns, and profitability insights that stakeholders can explore themselves.

Oliver Deacon
Former Finance Director, Microsoft Seattle · Finance Leadership Coach
The course has been built in collaboration with Oliver Deacon, who spent several years as a Finance Director at Microsoft in Seattle, where he worked at the cutting edge of leveraging technology and data in financial and commercial reporting.
He experienced firsthand the value generated by using these technologies to redesign processes, raise the quality of output while reducing the time spent doing so, and extract more value and insight from the organisation’s data.
"As a former Microsoft Finance Director, I know how crucial effective month-end reporting to drive action is. We spend so long building manual reports, only for the business to ask us for a different cut or more data – if they even look at them at all!
We built this Power BI course to provide finance teams with everything they need to create insightful and actionable commercial month-end reports. It focuses exclusively on finance reporting, helping you generate more engaging reports and scale your impact by enabling the business to self-serve."
Oliver Deacon
Former Finance Director, Microsoft
Testimonials
What learners say

"The course provided me with the essential foundations in data structure, mapping, and reporting, enabling me to create impactful dashboards from scratch. It not only saved me time and streamlined processes but also empowered me to deliver innovative solutions that added significant value to our business.
I wholeheartedly recommend this course to anyone seeking to get introduced to Power BI and understand its potential in data visualisation and analysis, tailored specifically to finance reporting."
Pieria Protopapa
FP&A Manager, Clear Business

"Dan offers an easy introduction into Power BI whilst in the environment accountants feel most comfortable.
Good pace and expansion into technical areas allows for one to come away ready to apply in your own setting."
Kevin Greenaway
Finance Director, The YES YES Company
"Superb way to learn Power BI! Clearly geared to accountants and the financial reporting process."
Khilan Haria
Head of Strategic Planning, David Lloyd Leisure
Certificate & CPD
Earn a certificate. Support your CPD.
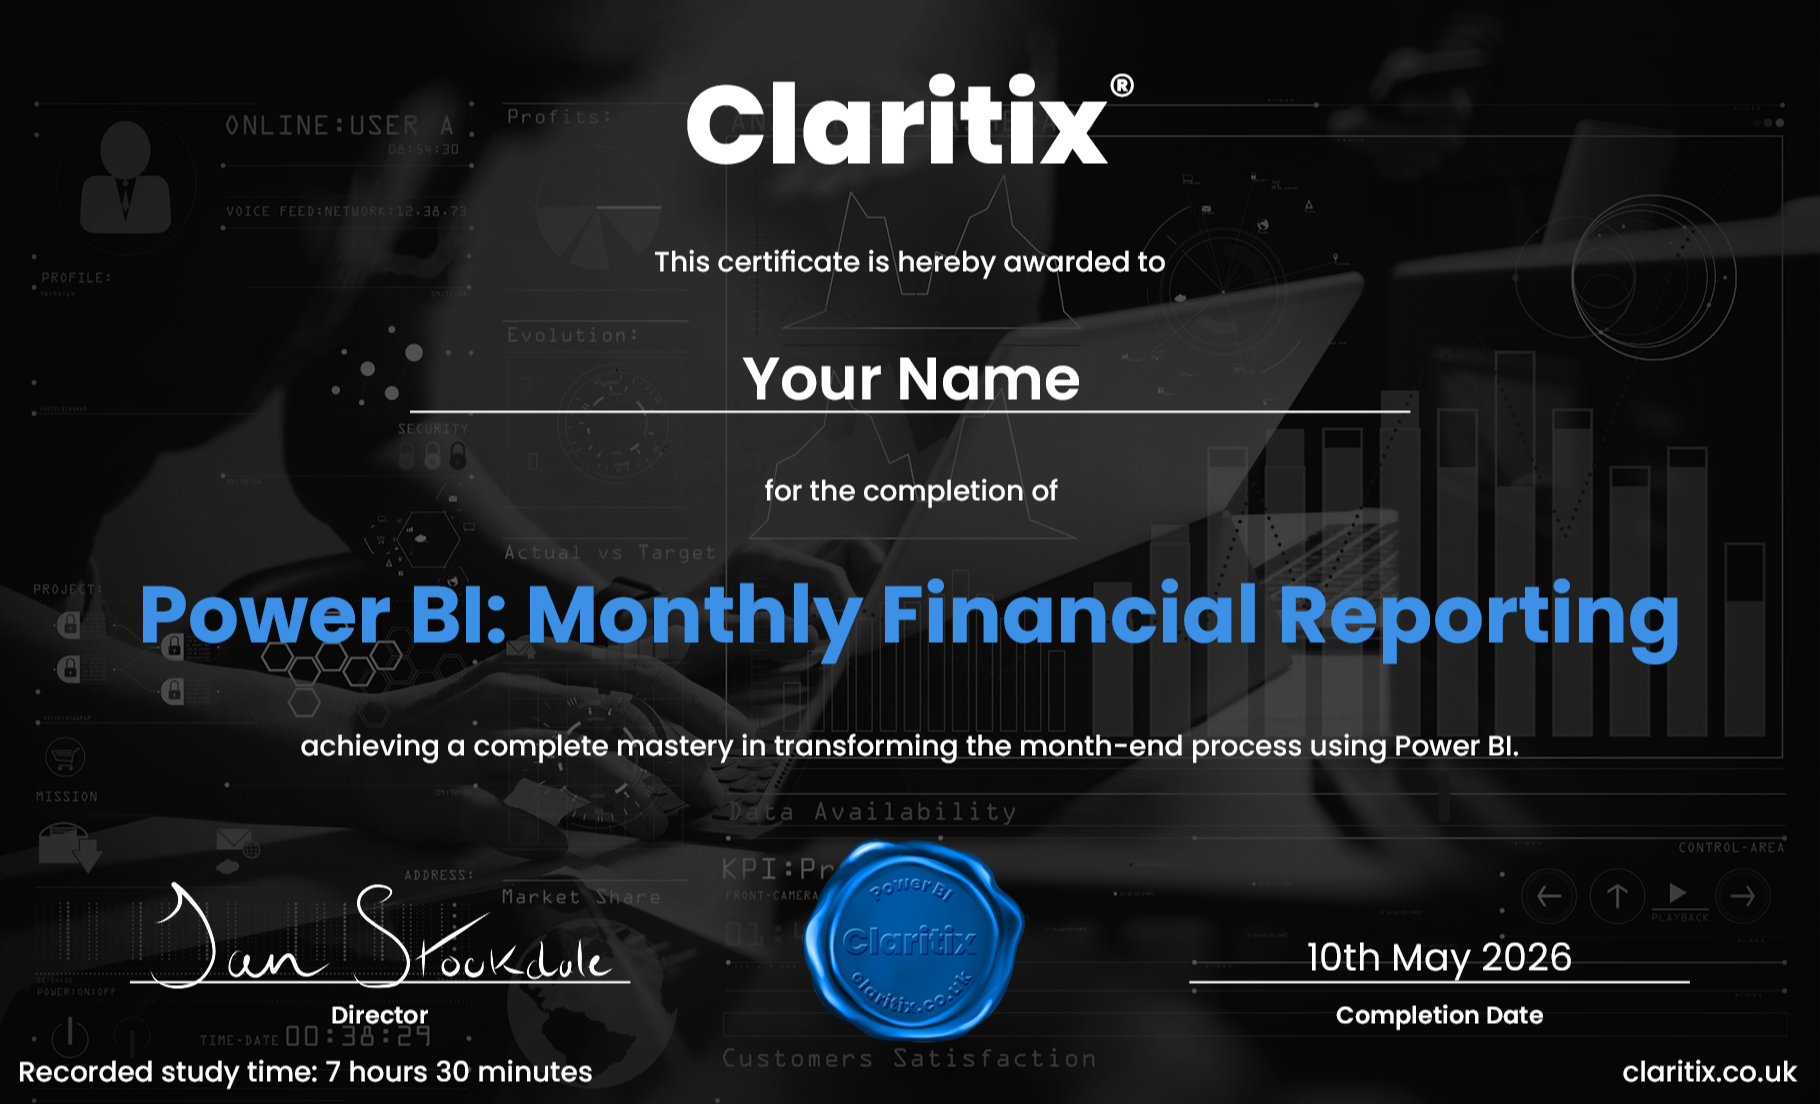
On completion you’ll receive a personalised PDF certificate showing your name, the course title, completion date and your recorded study time, designed to support CPD record-keeping.
Whether you are working towards a CIMA, ACCA, ICAEW, or CIPFA CPD commitment, this course provides verifiable evidence of structured learning. A VAT receipt is available following purchase, making it straightforward to expense through your employer’s training budget.
If you're outside the UK, particularly in the US, please check your professional body's specific requirements before relying on this certificate for CPD/CPE purposes. Claritix courses are not currently certified by NASBA.
Free resource
Not ready to enrol yet? Start here for free.
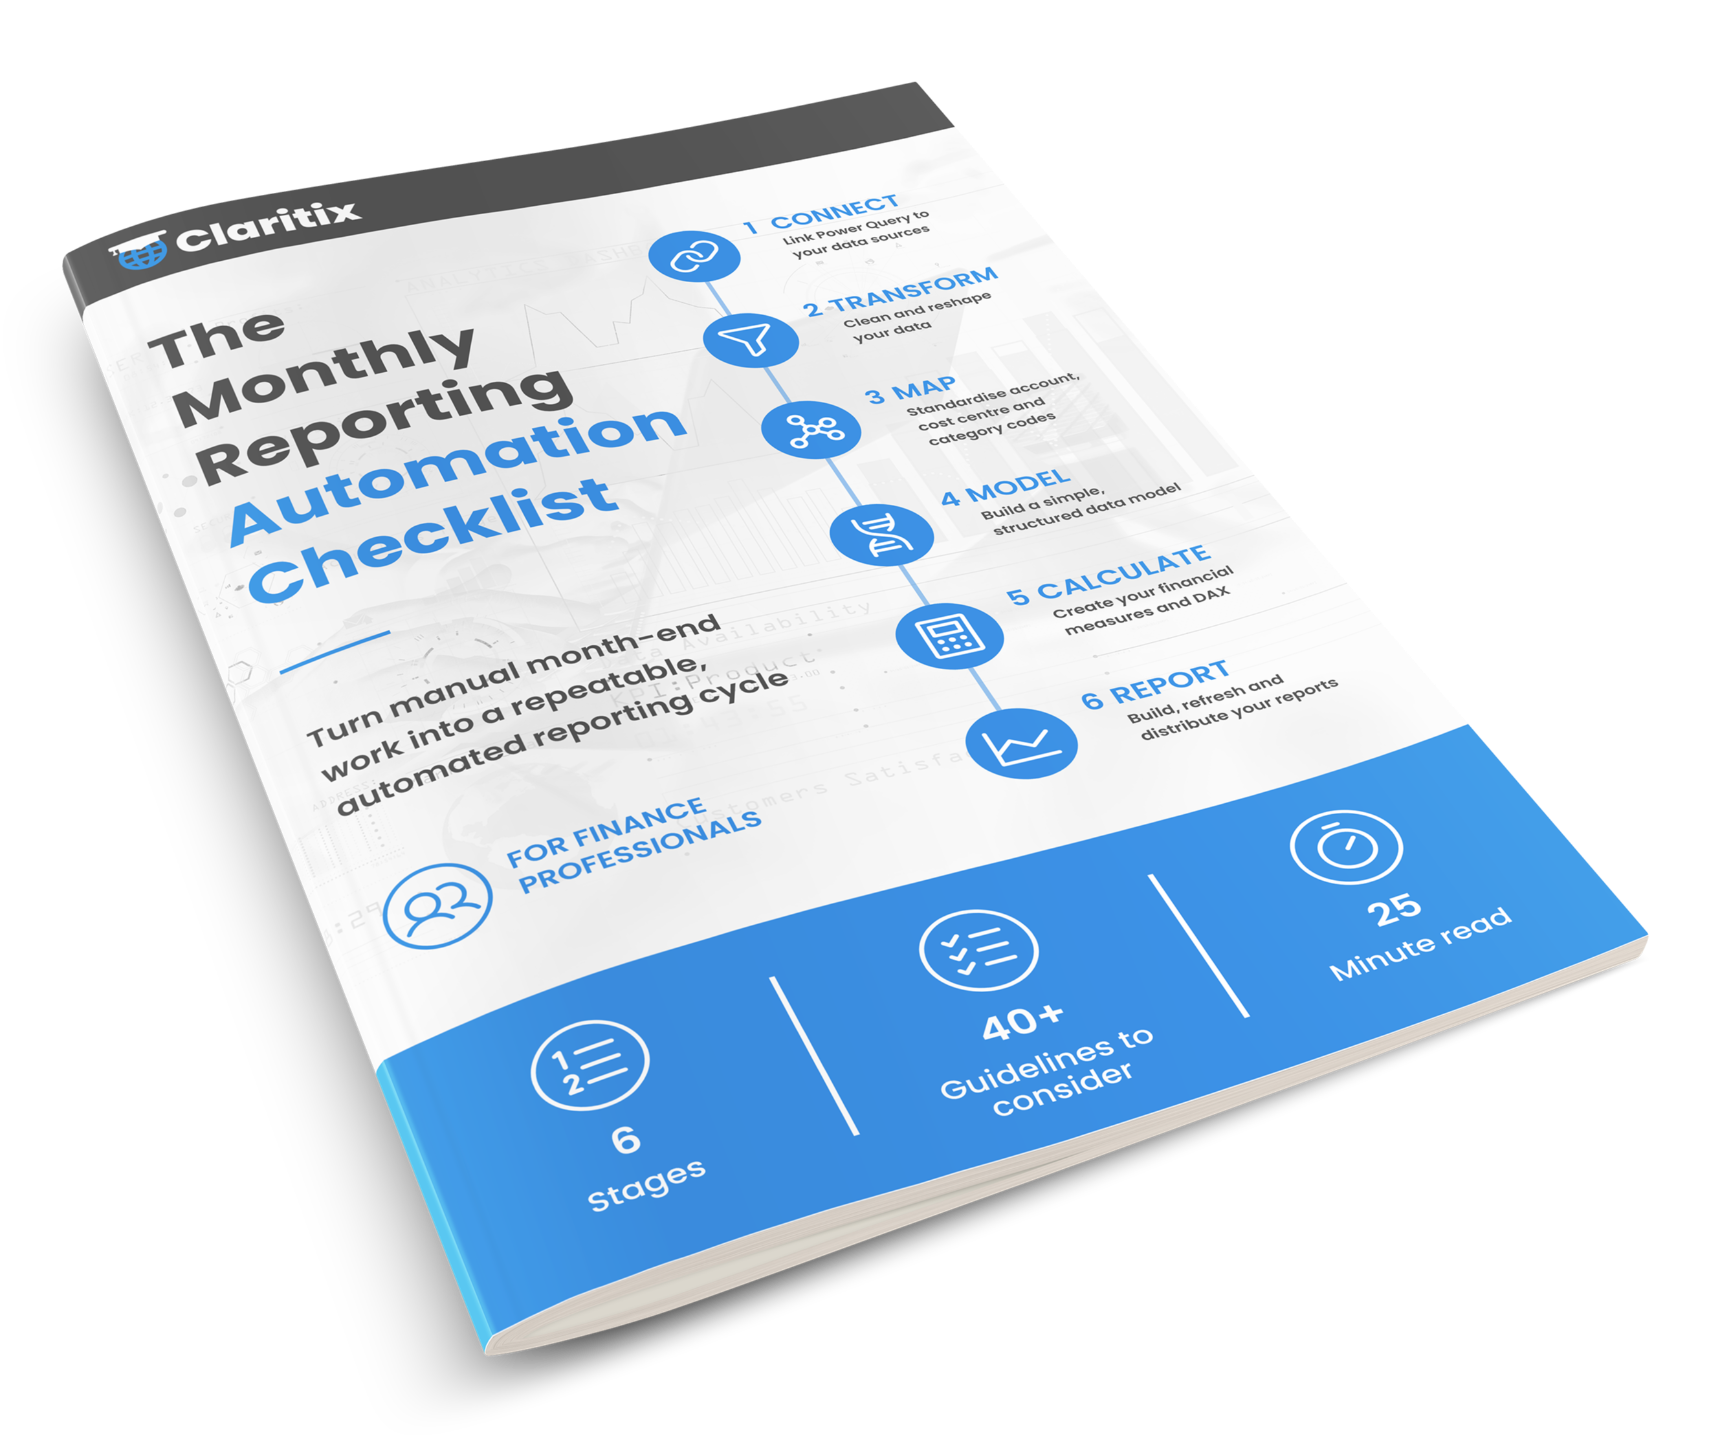
Download the Monthly Reporting Automation Checklist – a free guide to assessing your current process and identifying exactly where Power BI could save you time each month.
Sign up below and we will send it straight to your inbox. No spam. Unsubscribe at any time.
By subscribing you agree to your data being stored and receiving occasional marketing emails.
Pricing
Invest in yourself
Both options include immediate access to all course materials. Single payment, no subscription, no auto-renewal.
Upgrade to Power Automation Bundle
£465 + VAT
Save up to £125 vs buying separately · 12-month access
View the Power Automation BundleFAQ
Frequently asked questions
Do I need to know Power BI already?
Is this suitable if I am an accountant, not a data analyst?
Why Power BI, and not Power Query & Power Pivot?
How long will it take to complete?
Will I get files to work with?
Can I use this for CPD? Can I expense it?
Should I buy this course, the Power Automation Bundle, or the Big Data Bundle?
What software do I need?
What happens after I buy?
I already have Power Query & Power Pivot, should I add this course?
Ready to start?
Stop rebuilding your reports every month-end.
Enrol today and get immediate access to the full course, all exercise files, and your 92-page slide deck. Learn at your own pace over 12 months.
12-month access · No subscription · CPD certificate included · Immediate access on purchase